sidenote

Archívum
A(z) „videó” címke bejegyzései

In one of my latest posts I mentioned a question about how to draw individual glyphs with randomized paths on TeX.SX. Today I want to share the answer I posted about two weeks ago, and some related stuff which I’ve made during and after working on the answer.

Let’s see the question first. It is quoting Donald Knuth’s article, Mathematical typography from the Bulletin of the American Mathematical Society.
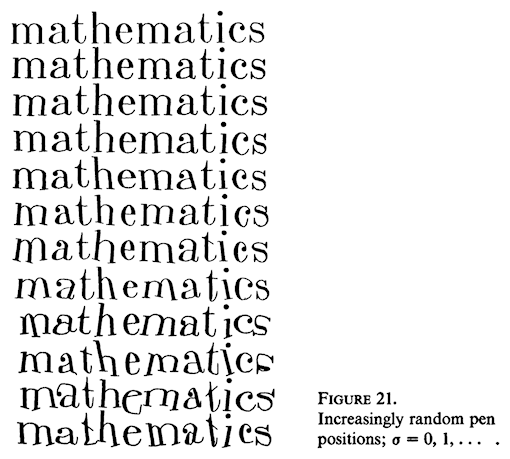
Knuth: Mathematical typography, Figure 21

Randomization. I’d like to report on a little experiment I did with random numbers. One might complain that the letters I have designed are too perfect, too much like a computer, so they lack “character”. In order to counteract this, we can build a certain amount of randomness into the choices of where to put the pen when drawing each letter, and Figure 21 shows what happens. The coordinates of the key pen positions where chosen independently with a normal distribution and with increasing standard deviation, so that the third example has twice as much standard deviation as the second, the fourth has three times as much, and so on. Note that the two m’s on each line (except the first) are different, and so are the a’s and the t’s, since each letter is drawn randomly.

The question was how to achieve a similar effect in LaTeX without using MetaFont. You can read the answer below, but if you feel tl;dr skip below the long quote for my related works.

I have been thinking about this question for weeks now, and finally I think I came really close to a result you may also like. I have even tried to use Processing to solve this problem, which resulted in a nice animation as a byproduct, but it didn’t lead me closer to the solution. But back to the point…

Unfortunately the solution I’m posting, which is my best and only shot, does not support drawing the distorted glyphs as text but as drawings. Also there is some work to be done outside the context of LaTeX, but most of it is done in LaTeX (LuaTeX + TikZ).
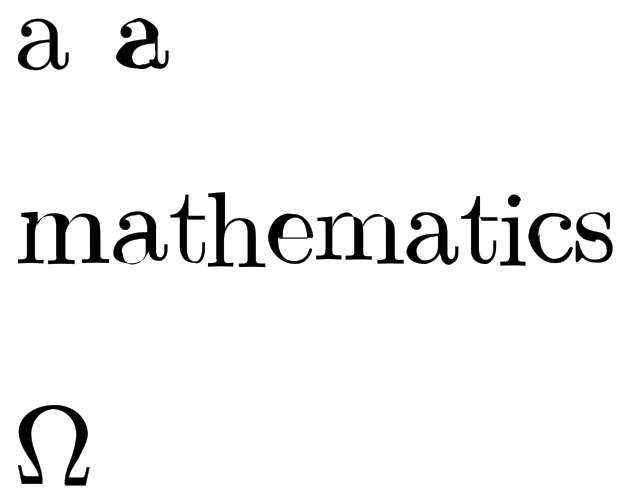
Randomized drawing of individual glyphs

The picture above shows an undistorted glyph (character “a” on the left in the line at the top), a distorted glyph (character “a” on the right in the line at the top), a word consisting of distorted glyphs (middle line), and a special character (Omega), all these can be found in the code at the end of the answer.

Now I will describe the process I have followed to achieve these distortions. I mentioned that there is some work to be done outside of LaTeX, that is to convert a font file into SVG using FontForge. I found the solution how to do this in an answer to the question: Can we extract the points making the character from the font file?

Copy the following into a file named font2svg.pe into your “project” folder.

1
2
3
#!/usr/bin/env fontforge
Open($1)
Generate($1:t:r + ".svg")

And make a SVG file from the font you want to use (I chose cmr10) with the following command.

fontforge font2svg.pe /usr/local/texlive/2014/texmf-dist/fonts/type1/public/amsfonts/cm/cmr10.pfb

Note that the location of the font on the filesystem may vary based on your LaTeX installation and operating system you use, but this will generate an SVG file into your project folder. All is left to process the generated SVG file which contains the data (name, unicode code, width, and outline) of the glyphs, which I will describe below.

The function function read_font_data(file) takes a file name as an argument (the generated SVG file), and extracts the data of the glyphs into an associative array which can be addressed with the unicode code and contains the width and outline data of the specific character. Note that not all glyphs have width or outline data, some basic error checking is done but the code is not foolproof.

The function random_in_interval(lower_boundary, upper_boundary) takes two float arguments, and will return a random float between them. The more the boundaries converge to 1 the smaller the randomization will be. This will be used when the time comes to randomize the outline of a glyph.

The function scale_and_randomize(glyph, scale_factor, lower_boundary, upper_boundary) will take a glyph, a scale factor, a lower and upper boundary, the latter two will be used for the randomization. Scaling is needed because the default measurement unit of TikZ is centimeters (I think) and the outline data of a glyph may contain large values, which TikZ interprets as centimeters. Note that the scale factor may vary depending the font you use, and size you want.

The functions print_glyph(glyph, scale_factor, lower_boundary, upper_boundary) and return_glyph (the latter takes the same arguments) only differ in that print_glyph will pass the TikZ drawing command (using svg.path library) used to print the glyph to LaTeX, while return_glyph only returns the drawing command as a string which can be further used in Lua before passing it to LaTeX.

The remaining functions only use the previously described print_glyph and return_glyph functions to print the picture above.

That’s it. I hope this would fit your needs.

1
2
3
4
5
6
7
8
9
10
11
12
13
14
15
16
17
18
19
20
21
22
23
24
25
26
27
28
29
30
31
32
33
34
35
36
37
38
39
40
41
42
43
44
45
46
47
48
49
50
51
52
53
54
55
56
57
58
59
60
61
62
63
64
65
66
67
68
69
70
71
72
73
74
75
76
77
78
79
80
81
82
83
84
85
86
87
88
89
90
91
92
93
94
95
96
97
98
99
100
101
102
103
104
105
106
107
108
109
110
111
112
113
114
115
116
117
118
119
120
121
122
123
124
125
126
127
128
129
130
131
132
133
134
135
136
137
138
139
140
141
142
143
144
145
146
147
148
149
150
151
152
153
154
155
156
157
158
159
160
161
162
163
164
165
166
167
168
169
170
171
172
173
174
175
176
177
178
179
180
181
182
183
184
185
186
187
188
189
190
191
192
193
194
195
196
197
198
199
200
201
202
203
204
205
206
207
208
209
210
211
212
213
214
215
216
217
218
219
220
221
222
223
224
225
226
227
228
229
230
231
% Randomized drawing of individual glyphs
% Author: István Szántai (szantaii)
% Original at: http://tex.stackexchange.com/a/197677/8844
\documentclass[10pt, a4paper]{article}

\usepackage[T1]{fontenc}

\usepackage{luacode}

\usepackage{tikz}
\usetikzlibrary{svg.path, positioning}

\pagestyle{empty}

\tikzset{%
    glyph node/.style={%
        inner sep=0pt,%
        outer sep=0pt%
    },%
    glyph outline/.style={%
        line width=0pt%
    }%
}

\begin{luacode*}
    function read_font_data(file)
        local glyphs = {}
        local fd = io.open(file, "r")
        local content = fd:read("*all")
        fd.close()
       
        for glyph in string.gmatch(content, "<glyph[^/>]*") do
            local glyph_tag = string.gsub(glyph, "\n", " ")
            local unicode = string.match(glyph_tag, "unicode="[^"]*")
            local outline = string.match(glyph_tag, "d="[^"]*")
            local width = string.match(glyph_tag, "horiz%-adv%-x="[^"]*")
           
            if unicode ~= nil and #unicode >= 10 then
                unicode = string.sub(unicode, 10, #unicode)
            end
           
            if outline ~= nil and #outline > 4 then
                outline = string.sub(outline, 4, #outline)
            end
           
            if width ~= nil and #width >= 14 then
                width = string.sub(width, 14, #width)
            end
           
            if unicode ~= nil then
                glyphs[unicode] = {width, outline}
            end
        end
       
        return glyphs
    end
   
    -- returns a random float number between the specified boundaries (floats)
    function random_in_interval(lower_boundary, upper_boundary)
        return ((math.random() * (upper_boundary - lower_boundary)) + lower_boundary)
    end
   
    -- note: scaling is applied before randomization
    function scale_and_randomize(glyph, scale_factor, lower_boundary, upper_boundary)
        local width = glyph[1]
        local outline = glyph[2]
       
        local previous_was_number = false
        local processed_outline = ""
        local number = ""
       
        if width ~= nil then
            width = width * scale_factor
        end
       
        if outline ~= nil then
            for i = 1, #outline, 1 do
                local char = string.sub(outline, i, i)
               
                if previous_was_number then
                    if string.match(char, '%d') ~= nil or
                        char == "." then
                        number = number .. char
                    else
                        -- scale and randomize
                        number = number * scale_factor
                        number = number * random_in_interval(lower_boundary, upper_boundary)
                        number = string.format("%.3f", number)
                        processed_outline = processed_outline .. number .. char
                        number = ""
                        previous_was_number = false
                    end
                else
                    if string.match(char, '%d') ~= nil or
                        char == "-" then
                       
                        number = number .. char
                        previous_was_number = true
                    else
                        processed_outline = processed_outline .. char
                        previous_was_number = false
                    end
                end
            end
        end
       
        return {width, processed_outline}
    end
   
    function print_glyph(glyph, scale_factor, lower_boundary, upper_boundary)
        local randomized_glyph = scale_and_randomize(glyph, scale_factor, lower_boundary, upper_boundary)
        local width = randomized_glyph[1]
        local outline = randomized_glyph[2]

        if outline ~= nil then
            tex.sprint("\\filldraw[glyph outline] svg "" .. outline .. "";")
        end
    end
   
    function return_glyph(glyph, scale_factor, lower_boundary, upper_boundary)
        local randomized_glyph = scale_and_randomize(glyph, scale_factor, lower_boundary, upper_boundary)
        local width = randomized_glyph[1]
        local outline = randomized_glyph[2]
       
        if outline ~= nil then
            return "\\filldraw[glyph outline] svg "" .. outline .. "";"
        else
            return ""
        end
    end
   
    function draw_sample_glyphs(glyphs)
        tex.sprint("\\begin{tikzpicture}")
        tex.sprint("\\node[glyph node, matrix, anchor=south west] (a1) {" ..
            return_glyph(glyphs["a"], 0.05, 1, 1) ..
            "\\\\};")
        tex.sprint("\\node[glyph node, matrix, anchor=south west, right=7.5mm of a1] (a2) {" ..
            return_glyph(glyphs["a"], 0.05, 0.8, 1.2) ..
            "\\\\};")
        tex.sprint("\\end{tikzpicture}")
    end
   
    function draw_sample_text(glyphs)
        local horizontal_space = "0.5mm"
        local vertical_space = "1.25mm"
        local scale = 0.05
        local lower_boundary = 0.9
        local upper_boundary = 1.1
       
        tex.sprint("\\begin{tikzpicture}")
        tex.sprint("\\node[glyph node, matrix] (m1) {" ..
            return_glyph(glyphs["m"], scale, lower_boundary, upper_boundary) ..
            "\\\\};")
       
        tex.sprint("\\node[glyph node, matrix, right=" .. horizontal_space ..
            " of m1] (a1) {" ..
            return_glyph(glyphs["a"], scale, lower_boundary, upper_boundary) ..
            "\\\\};")
       
        tex.sprint("\\node[glyph node, matrix, right=" .. horizontal_space ..
            " of a1] (t1) {" .. "\\raisebox{" .. vertical_space .. "}{" ..
            return_glyph(glyphs["t"], scale, lower_boundary, upper_boundary) ..
            "}" .. "\\\\};")
       
        tex.sprint("\\node[glyph node, matrix, right=" .. horizontal_space ..
            " of t1] (h1) {" .. "\\raisebox{" .. vertical_space .. "}{" ..
            return_glyph(glyphs["h"], scale, lower_boundary, upper_boundary) ..
            "}" .. "\\\\};")
       
        tex.sprint("\\node[glyph node, matrix, right=" .. horizontal_space ..
            " of h1] (e1) {" ..
            return_glyph(glyphs["e"], scale, lower_boundary, upper_boundary) ..
            "\\\\};")
       
        tex.sprint("\\node[glyph node, matrix, right=" .. horizontal_space ..
            " of e1] (m2) {" ..
            return_glyph(glyphs["m"], scale, lower_boundary, upper_boundary) ..
            "\\\\};")
       
        tex.sprint("\\node[glyph node, matrix, right=" .. horizontal_space ..
            " of m2] (a2) {" ..
            return_glyph(glyphs["a"], scale, lower_boundary, upper_boundary) ..
            "\\\\};")
       
        tex.sprint("\\node[glyph node, matrix, right=" .. horizontal_space ..
            " of a2] (t2) {" .. "\\raisebox{" .. vertical_space .. "}{" ..
            return_glyph(glyphs["t"], scale, lower_boundary, upper_boundary) ..
            "}" .. "\\\\};")
       
        tex.sprint("\\node[glyph node, matrix, right=" .. horizontal_space ..
            " of t2] (i1) {" .. "\\raisebox{" .. vertical_space .. "}{" ..
            return_glyph(glyphs["i"], scale, lower_boundary, upper_boundary) ..
            "}" .. "\\\\};")
       
        tex.sprint("\\node[glyph node, matrix, right=" .. horizontal_space ..
            " of i1] (c1) {" ..
            return_glyph(glyphs["c"], scale, lower_boundary, upper_boundary) ..
            "\\\\};")
       
        tex.sprint("\\node[glyph node, matrix, right=" .. horizontal_space ..
            " of c1] (s1) {" ..
            return_glyph(glyphs["s"], scale, lower_boundary, upper_boundary) ..
            "\\\\};")
        tex.sprint("\\end{tikzpicture}")
    end
   
    function draw_sample_glyph(glyphs)
        tex.sprint("\\begin{tikzpicture}")
        print_glyph(glyphs["&#x3a9;"], 0.05, 0.95, 1.05)
        tex.sprint("\\end{tikzpicture}")
    end
   
    function main()
        local cmr10_glyphs = {}
       
        math.randomseed(os.time())
       
        cmr10_glyphs = read_font_data("cmr10.svg")
       
        tex.sprint("\\noindent")
        draw_sample_glyphs(cmr10_glyphs)
        tex.sprint("\\\\[2cm]")
        draw_sample_text(cmr10_glyphs)
        tex.sprint("\\\\[2cm]")
        draw_sample_glyph(cmr10_glyphs)
    end
\end{luacode*}

\begin{document}
\luadirect{main()}
\end{document}

Nice, isn’t it?

I’ve created an animation in LaTeX (clarification later) using this code, which makes the letter “a” wibbly-wobbly. There is also a video which shows the same letter but only the outline is drawn, but in my opinion it doesn’t look that good: Glyph distortion – YouTube.

https://www.youtube.com/watch?v=qd7i83b6DjI

These videos are also available on Vimeo: Glyph distortion on Vimeo, Glyph distortion #2 on Vimeo.

The second animation (also made in LaTeX) draws a big letter “a” stacking only outlines of it on top of each other which it gives a hollow like look.

https://www.youtube.com/watch?v=eTM3fKI5W6Y

This video is also available on Vimeo: Font outline animation #2 on Vimeo.

Only one question remains, how did I made these animations in LaTeX? I just built upon the code above, and rendered a long PDF which’s each page is a frame of the animation. After that I only followed some steps I’ve described before.
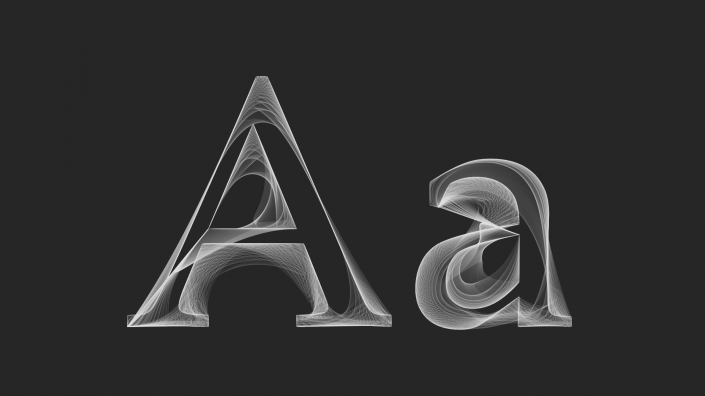
https://www.youtube.com/watch?v=NpCqjrXWzuQ

The video is also available on Vimeo.

This animation is strongly connected to LaTeX. How come? – you could ask. I’ll come to the point but first I have to confess that this nice piece of video/animation/whatever is “only” a byproduct of a search for a LaTeX related answer.

I’m a LaTeX enthusiast, and I’m trying to be active on TeX.SX, and found a question about how to draw individual glyphs with randomized paths which I could not stop thinking about. I even wanted to learn Metapost, but when I saw what was laying before me I was intimidated. So I thought I should try something easier first, namely Processing, which was very useful for some small projects in the past. I found the Geomerative library written by Ricard Marxer, and when I was looking into the examples which came with the library I found an interesting one, which used the vertices of font outlines. Then came the idea that it would be nice to try to polygonize individual glyphs with different accuracy, draw Bézier curves along/through the vertices, and stack these images on top each other. Just to see how it looks. In the end it turned out to be pretty awesome, I think.

Font outline animation

I’m sharing the source with some notes what and how it does what it does, so others may come up with nice things too. But if you don’t want the “magic” to be debunked, this is where you should stop reading this post.

Note that the following source code comes with no warranty at all, and is under the CC BY-NC-SA 2.5 license.

1
2
3
4
5
6
7
8
9
10
11
12
13
14
15
16
17
18
19
20
21
22
23
24
25
26
27
28
29
30
31
32
33
34
35
36
37
38
39
40
41
42
43
44
45
46
47
48
49
50
51
52
53
54
55
56
57
58
59
60
61
62
63
64
65
66
67
68
69
70
71
72
73
74
75
76
77
78
79
80
81
82
83
84
85
86
87
88
89
90
91
92
93
94
95
96
97
98
99
100
101
102
103
104
105
106
107
108
109
110
111
112
113
114
115
116
117
118
119
120
121
122
123
124
125
126
/*
Font outline animation
Author: István Szántai (szantaii)
License: CC BY-NC-SA 2.5
*/

import geomerative.*;
import processing.pdf.*;

int frameCount;
float backgroundColor;
float strokeColor;
float strokeOpacity;
float fadeOutOpacity;
float fadeOutOpacityStep;
RShape shape;
RPoint[] points;
int initialPolygonizerLength;
int currentPolygonizerLength;


void setup()
{
  frameCount = 0;
  backgroundColor = 38.25;
  strokeColor = 229.5;
  strokeOpacity = 25.5;
  fadeOutOpacityStep = 10.625;
  fadeOutOpacity = fadeOutOpacityStep;
 
  size(1280, 720, PDF, "frames.pdf");
 
  RG.init(this);

  initialPolygonizerLength = 179;
  currentPolygonizerLength = initialPolygonizerLength;
 
  print("Drawing...");
 
  smooth();
}

void draw()
{
  PGraphicsPDF pdf = (PGraphicsPDF) g;
 
  if (frameCount < 45)
  {
    background(backgroundColor);
    pdf.nextPage();
  }
  else if (frameCount < 399)
  {
    background(backgroundColor);
    noFill();
    strokeCap(ROUND);
    strokeJoin(ROUND);
    stroke(strokeColor, strokeOpacity);
 
    drawBezierVertices("A", width / 2 - 180, 4.95 * height / 6);
    drawBezierVertices("a", width / 2 + 230, 4.95 * height / 6);
   
    if (currentPolygonizerLength > 0)
    {
      --currentPolygonizerLength;
    }
   
    if (frameCount >= 375)
    {
        noStroke();
        fill(backgroundColor, fadeOutOpacity);
        rect(0, 0, 1280, 720);
        fadeOutOpacity += fadeOutOpacityStep;
    }
   
    pdf.nextPage();
  }
  else if (frameCount < 429)
  {
    background(backgroundColor);
    if (frameCount != 428)
    {
      pdf.nextPage();
    }
  }
  else
  {
    println(" done.");
    exit();
  }
 
  frameCount++;
}

void drawBezierVertices(String text, float horizontalPos, float verticalPos)
{
  shape = RG.getText(text, "Palatino-Roman.ttf", 650, CENTER);
  pushMatrix();
  translate(horizontalPos, verticalPos);
 
  for (int i = initialPolygonizerLength; i >= currentPolygonizerLength; i--)
  {
    RG.setPolygonizer(RG.UNIFORMLENGTH);
    RG.setPolygonizerLength(i);
    points = shape.getPoints();
   
    if(points != null && points.length > 3)
    {
      beginShape();
      for(int j = 0; j < points.length - 3; j++)
      {
        if (j == 0)
        {
          vertex(points[j].x, points[j].y);
        }
        else
        {
          bezierVertex(points[j].x, points[j].y,
            points[j + 1].x, points[j + 1].y,
            points[j + 2].x, points[j + 2].y);
        }
      }
      endShape();
    }
  }
  popMatrix();
}

The most important stuff is in the definition of the drawBezierVertices function. This is how it works. It gets a piece of text, which will be “written” with a defined font (note that the chosen font should be in the project’s data folder) making a shape, but it won’t be drawn to the screen. Instead the shape will be polygonized and through the calculated vertices a bezier curve will be drawn. This is iterated a couple times (180 times in this specific example) while vertices are getting closer to each other, so at the end a the true outline of the font would be drawn (more or less).

By reading the source you can also see that every frame of the animation is rendered to pages of a PDF document. Here is why. When rendering to PDF Processing will create a vectorized output. So in the end you can get the frames from the PDF in any resolution you want without losing quality. All is left to rasterize every page of the rendered PDF with the desired resolution into individual raster images (PNG files if you ask me), and make a video from the created image sequence.

Some practical advice. I’ve used Gimp to rasterize the pages of the PDF output (with FullHD, 1920×1080 resolution), and saved them as separate files using the Export Layers plugin. After that I made the image sequence into a video from the command-line using FFmpeg.

ffmpeg -r 30 -i %03d.png -c:v libx264 -preset veryslow -qp 0 -g 1 -bf 2 font_animation.mp4

Csak néhány videó, kép és animáció, amik érdekesek lehetnek. Remélem nem kell mondanom, hogy a képek kattintásra nagyobbak lesznek.

Az SDK-ra leghamarabb hétvégén tudok pillantást vetni. Lehet, hogy arról is ejtek majd pár szót.

Ubuntu for phones

Hands-on videók az engadgettől, és a Verge-től:

https://www.viddler.com/v/ac8413f3

https://www.youtube.com/watch?v=kXWnMTm7We8

App ikonok:

Kérdés persze, hogy ezek közül melyek a natívak, és melyek azok amik csak webappok. Skype?

Infografikák:

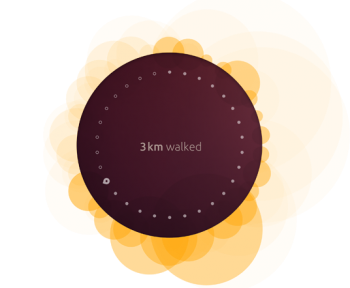
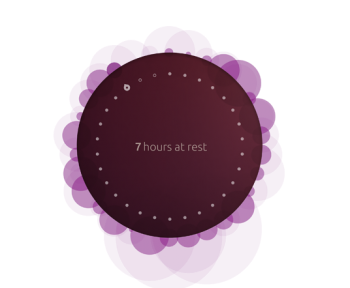
Ubuntu for phones infographics #1 Ubuntu for phones infographics #2
Ubuntu for phones infographics #3 Ubuntu for phones infographics #4

Animációk:

Ubuntu for phones

https://www.youtube.com/watch?v=cpWHJDLsqTU

ubuntu.com/devices/phone

A többit majd holnap.

Poszt-apokaliptikus cyberpunk point-and-click kalandjáték csodálatos zenével és grafikával. Ezzel leptem meg magam karácsonyra.

What happened to the humans?

Set in a post-apocalyptic world strewn with cast-off machines, Primordia tells the story of Horatio Nullbuilt, a stoic robot who values his solitude and independence. Horatio spends his days studying the Book of Man, sparring with his droid companion Crispin, and tinkering with the airship they call home — a peaceful existence that becomes threatened when a rogue robot steals the energy source that the pair needs to survive.

When Horatio and Crispin’s search for energy brings them to the dazzling city of Metropol, the simple quest to recover their stolen power core leads to unexpected discoveries about Horatio’s origins and a new understanding of the legendary humans who walked the earth before him.

Primordia

https://www.youtube.com/watch?v=0YvWQi_5fsw

https://www.youtube.com/watch?v=zj9bFgsaBd4

Valamint egy egész alapos poszt az egész gyártási folyamatról:

Pete Lomas is a trustee of the Raspberry Pi Foundation, and designed the final hardware that turned into the Raspberry Pi. We’ve had so many questions from you about the manufacturing process that Pete decided to put this post together—he’s been working on it for a couple of months, and we’re very, very grateful. Thanks Pete—and thank you to everybody at the Sony factory!

Sony, the Pi makers – a post from Pete Lomas

Imádom az ilyen videókat. Több ehhez hasonlót posztoltam már: Cassini, Earth | Time Lapse View from Space, Fly Over | NASA, ISS.

https://vimeo.com/44801709

Image courtesy of the Image Science & Analysis Laboratory, NASA Johnson Space Center
eol.jsc.nasa.gov/Videos/CrewEarthObservationsVideos/
Music: The XX – Intro

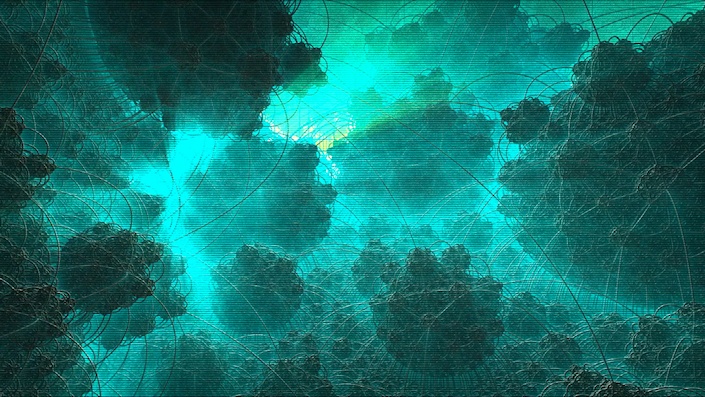
Worthy winner of the PC 4kB intro competition at Revision 2012 and latest example of the compact-coding tradition exercised within the demoscene, Hartverdrahtet by Akronyme Analogiker is a three minute long audio-visual trip into a procedural fractalverse, compressed into a minuscule piece of software. No bigger than 4069 bytes – less than an empty Word document, as demoscene activists like to point out – the executable file contains all the mathematics needed to generate the unfolding visual complexity and audible ambience upon a double-click. A solo effort by a talented coder who calls himself Demoscene Passivist, Hartverdrahtet reveals a mesmerizing cosmos observed through what could be an electron microscope – ethereal, greenish and a little eerie.

The real magic is in the lingo: “It’s a mix of shere-tracing, fake ambient occlusion and a lot of post-processing. And it took me nearly two months to complete it,” the programmer and recipient of last year’s ‘Echtzeit Newcomer Award‘ reveals on his Tumblr. “The shader basically encapsulates a sphere-tracing based raymarcher for a single fractal formula with camera handling. An extra post-processing shader adds effects like god-rays, tv-lines and noise to make the result look more interesting and less ‘sterile’. The different intro parts are all parameter and camera position variations of the same fractal.”

[…]

Hartverdrahtet – Infinite complexity in 4096 Kilobytes

És itt a lényeg, a teljes videó.

https://www.youtube.com/watch?v=0w_xEUoK79o

Elképesztő!

https://www.youtube.com/watch?v=Jv8MM9ffK0c

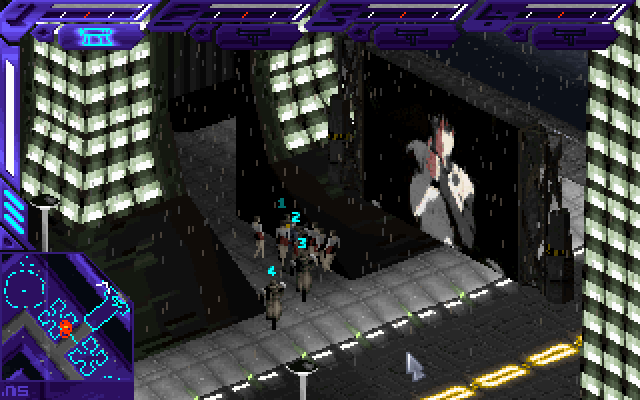
A Syndicate Warsban a hirdetőtáblákon többek között a Ghost in the Shell trailere futott. Cyberpunk at its best!

https://www.youtube.com/watch?v=xh0tStI2Xfw

https://www.youtube.com/watch?v=ewwtznVkSxA

Kommentben megígértem, hogy kiegészítem a posztot, de inkább csak kiteszem ide a kommentek releváns részeit.

Írta: Red 2012. április 25. 10:14
Hogy lemaradtam erről… Kicsit rossz szájízem van, hogy FPS-t csináltak belőle, de kíváncsi lennék rá, lehet, hogy beszerzem majd Xbox-ra.

Írta: szantaii 2012. április 25. 11:06
Én is így voltam vele. Jobban örültem volna valami stratégiai játéknak. Az FPS-ek (1-2 kivételtől eltekintve) már nemigazán kötnek le. Viszont ez elég ütős lett, jól visszaadja a régi hangulatot, persze azért sok minden hiányzik is belőle.
Van ez a Skrillex gyerek meg még 1-2 DJ [ejtsd: diddzséj :)], akik remixelték a régi zenéket ehhez az új játékhoz, és habár nem vagyok dubstep fan, mégis jók lettek.
[…]

https://www.youtube.com/watch?v=yVpbFMhOAwE

While Linux is running our phones, friend requests, tweets, financial trades, ATMs and more, most of us don’t know how it’s actually built. This short video takes you inside the process by which the largest collaborative development project in the history of computing is organized. Based on the annual report “Who Writes Linux,” this is a powerful and inspiring story of how Linux has become a volunteer-driven phenomenon.

How Linux is Built – YouTube

Nem hiszem, hogy ez a videó mezei usereknek szólna, inkább a befektetőknek, vagy az „üzleti szférának”, de jó látni, hogy végre a Linux Foundation is össze bírt rakni egy rendes videót.